Top Opportunities – October
- Nov 4, 2025
- 5 min read
Top Opps
• UAMY – Overextension+ Low Floats – Day 2
• BYND – Overextension + Low Floats – Day 1
• QCOM – Breaking News
UAMY – Catalyst
What does the company do ?
• United States Antimony Corporation (UAMY) is a U.S.-based natural resource company focused on mining, processing, and supplying critical minerals and industrial materials, with operations in antimony, precious metals, zeolite, cobalt, and tungsten. The company positions itself as a key player in U.S. national security and domestic supply chain resilience, especially for antimony—a mineral critical to defense, energy, and technology
245M Pentagon Contract Award September 23 (announced early October)
• U.S. Defense Logistics Agency (DLA) awarded a multi-year contract to supply antimony ingots for the National Defense Stockpile, with the first $10M delivery order received on September 30. This underscores U.S. efforts to diversify from foreign suppliers.
$51.25M Capital Raise October 6–10th
• Raised funds via two above-market stock offerings ($26.25M at $7.50/share on Oct 6; $25M at $10.50/share on Oct 10), boosting cash to ~$64M for operations and expansion. CEO Gary Evans also bought 100,000 shares, signaling insider confidence.
Red Candle Happened on the 14th – But there no No Fresh News On that Day
Setup- Overextension
Weekly Charts – Technical Overview Trend & Structure
•Penny stock, fundamentally weak, but showing parabolic momentum since Dec 2024. •Initial breakout from $0.80, followed by a grind to $4, then another explosive breakout. •Currently moving exponentially higher — clearly overextended.
•Visible Legs: 3 on the weekly chart; 3rd leg shows strong overextension.
•Character: Classic MOMO move with minimal resets between legs.

Daily Overextension
•Stock is +2102% from the lows.
•Last 4 days: $9.72 move (+96.3%, 7.87× ATR).
•Both price and volume have capitulated — extreme expansion.
Volume Behavior
• Volume rising each day — a sign of climax buying:
Day 2: 35M
Day 3: 45M
Day 4: 53M
Clear acceleration in participation — increasing rate each session.
Others
On the 14th Stock has Gapped up – n Had Backside on the Day 1 Itself – Buyer Were preset at 16$ - Were Day 1 lows was present – In the PM Next Day it was holding Day 1
Rating – 10/10
Trade- Vwap Contiuation Trade
Intraday – VWAP Dynamics
Price Action Overview
•Day 1 (16th): Buyers defended the price strongly.
•Pre-Market: Weak, showing bouncy-ball price action around the 16 level, indicating sellers present.
•Open: Triggered an OD trade, but failed/stuffed, - Then Converted into ORB -
•Selling pressure wasn’t aggressive — more market-driven due to highstrength (HS) conditions.
• Trigger – ORB Price bounced from $15 to VWAP zone, where sellers reentered. It Test to 16$ ( important Level )
•Formed a 30-min consolidation before breaking lower.
•As the market sold off (HW), EV for the trade improved.

VWAP Checks
• 1st leg: < 1 ATR move with volume.
• Pullback: < 50% retracement with shallow volume.
• CHOCH (30) – Formed a lower high (LH) structure.
Market Context
• 1st leg was tricky – sellers not dominant early.
• Buyers defended initially; market weakness turned the trend.
• No volume increase on CHOCH breakout (a − ve check).
Trade Execution
• Entry: $15.35 (Breakout Entry)
• Stop Loss: $16.00 (Swing High + Round Number + Yesterday’s High)
• Exit: 15-min 9 EMA trend exit (Perfect trend follow-through)
Evaluation
• EV: 1.5
• Grade: B Trade (30% of opportunity risk)
BNYD – Catalyst
• What Does Company Do?
• Beyond Meat develops, manufactures, markets, and sells plant-based meat products designed to mimic the taste, texture, and nutrition of traditional animal-based meats. Their product lineup includes: Beef alternatives like Beyond Burger patties and Beyond Steak.
• Pork alternatives: Such as Beyond Sausage.
• Poultry alternatives: Including Beyond Chicken Tenders and Nuggets.
Walmart Distribution Expansion:
Announced recently, Beyond Meat inked a deal to place value-pack Beyond Burger 6-packs and other products in over 2,000 Walmart stores nationwide. This boosts visibility and potential sales in a key retail channel, providing a tangible business positive amid the speculation. Posts on X called it a "Walmart expansion boost" contributing to the 1,250% four-day gain.
Short Squeeze Dynamics:
With short interest exceeding 60% of the free float, the initial price pop forced short sellers to cover positions, accelerating the upward spiral. This created a feedback loop of buying pressure, pushing shares up 600% in just three days and 729% for the week. Traders on X described it as a "massive short squeeze" triggered by elevated volume.
Setup – Overextension
Weekly & Daily Structure
Weekly Chart
• Overall trend remains downward — forming lower highs (LHs) and lower lows (LLs) from the previous peaks.

Daily Chart
• Buyers stepped in at $0.50, reacting to a catalyst event that triggered a sharp surge.
• Stock rallied 2 strong days, followed by a 3rd-day exhaustion gap up (+70.44%).
• Total move: +1100% from the lows.
• Absolute move: $5.64, equal to 10.22× ATR in 3 sessions — fits overextension criteria.
• Price = Capitulated.
• Volume = Capitulated → 102B → 200B → 227B (sequential surge).
Intraday Setup – Backside Structure• On the 15-min timeframe, price began forming lower highs and rolling over, showing seller control emerging.• Overnight gap: +70.44% (exhaustion Gap).
Trade Evaluation
• Grade: 9/10
Trade – Fashionably Late
Intraday Structure
•Stock opened strong, forming an Opening Range Breakout (ORB) and initially broke to the upside.
•Price moved into the pre-market resistance zone, failed, and dipped below.
•Buyers re-bid from the ORB inflection point, but sellers began stepping down, forming lower highs (LHs).
•The ORB inflection point aligned with VWAP, creating a key confluence level (FL).

Shift in Control
•Around 11:00 AM, sellers took control, breaking: O Previous swing lows O ORB inflection point O Accompanied by volume expansion — 7M vs. 3M avg from prior candles.
Trade Plan
•Entry: $6.40 (Breakout Entry) •Stop Loss: $7.01 (Swing High + Round Number)
•Target / Exit Plan: O Look for 2-leg momentum (MOMO) move into yesterday’s lows. O Exit trigger: 2-min bar break on the 2nd leg.
Evaluation
•EV: 1.5
•Grade: B Trade (30% of opportunity risk)
QCOM – Catalyst
What Does Company Do?
• QUALCOMM, Inc. engages in developing and commercializing foundational technologies and products used in mobile devices and other wireless products. It operates through the following segments: Qualcomm CDMA Technologies (QCT), Qualcomm Technology Licensing (QTL), and Qualcomm Strategic Initiatives (QSI).
Primary Driver:Qualcomm announced its entry into the AI data center market with new AI accelerator chips and server rack solutions, directly challenging Nvidia (NVDA) and AMD.→ This move targets the rapidly growing AI infrastructure space, projected to exceed $500B in investments by 2026 and reach $6.7T globally by 2030 (McKinsey).
Key Announcement Details:
New Chips:
• AI200 (2026): Designed for AI inference (post-training processing) with LPDDR memory, offering cost and power efficiency advantages over Nvidia’s HBM-based chips.
• AI250 (2027): Next-generation follow-up to AI200.
• Third chip (2028): Planned future release to expand the lineup.
Server Racks:
• Integrated AI server rack systems with approximately 160kW power draw.
• Focused on total cost of ownership (TCO) reduction and energy-efficient AI workloads.
Strategic Shift:
Qualcomm is diversifying beyond smartphones (currently ~70% of revenue) into AI data centers, automotive, and IoT.→ Analysts view this as a “game-changer” for long-term growth, potentially adding $10–20B in annual revenue by 2030 with modest market share gains.
Partnership:
Qualcomm signed a deal with Saudi Arabia’s AI startup Humain for 200 megawatts of computing systems powered by Qualcomm chips, starting in 2026 — signaling early commercial demand.
Trade – Opening Drive Trade
Intraday Breakdown
• Catalyst Trigger:
News hit at 10:00 AM, shifting intraday momentum.
Prior to the news, average 2-min candle volume was ~38K shares.
On the news candle, volume surged to 700K shares — an 18× increase, confirming strong reaction and participation.
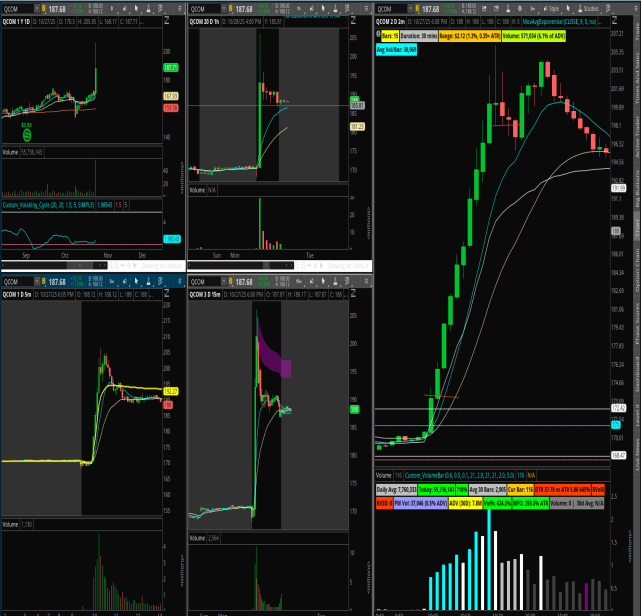
Price Structure & Key Levels
• The first 2-min candle closed above $173, an important HTF resistance level now turned support.
• Next key psychological and HTF levels:
$200 — round number resistance
$220 — higher timeframe resistance zone
Trade Execution
• Entry: $173.40 (2-min breakout candle close)
• Stop Loss: $170.40 (recent swing lows)
• Exit: $198.04 (2-min bar break exit trigger)
Evaluation
• EV: 4
• Grade: A Trade (80% of opportunity risk)

Comments